38 documents, six live dashboards, and every one of them reads the same record.
Every department here produces documents somebody outside the business will read — a main contractor, an auditor, a customer, a machine. This is the whole set, in one place.
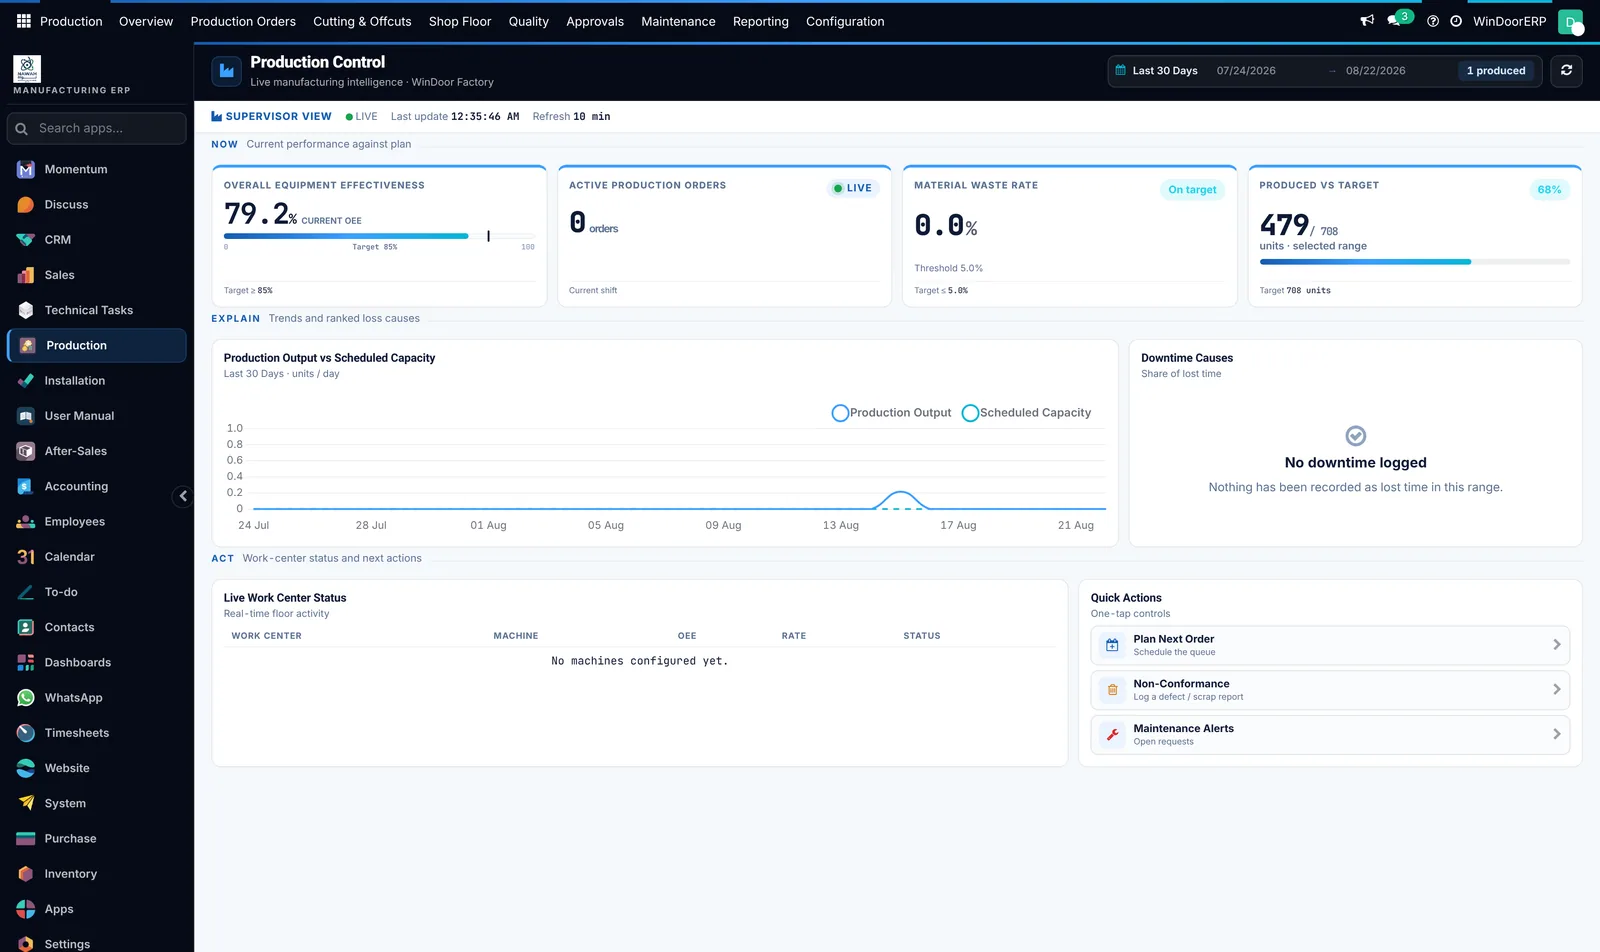
Thirty-eight documents the business issues
- Cutting optimisation, glass cutting list, profiles and accessories BOQ, wastage summary
- Work order traveller, elevation diagram, declaration of performance, delivery note
- Survey reports, site quality dossiers, installation handover pack, service report
- Progress certificates, and the full statutory accounting set
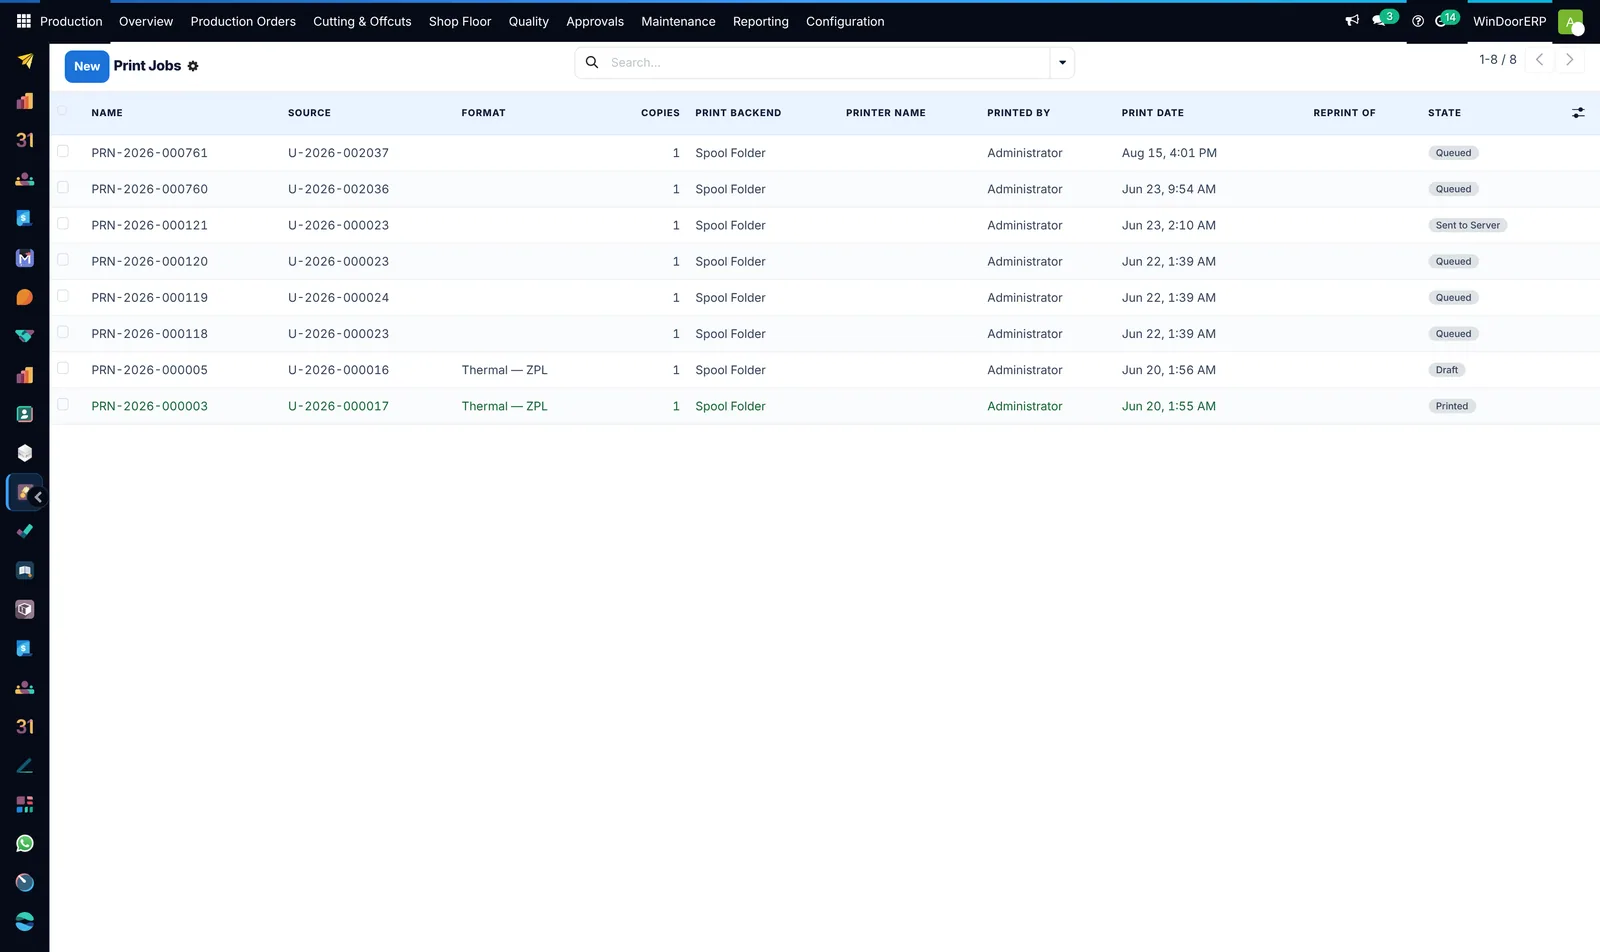
Six live dashboards, and one of them is honest about being empty
- Production Control, the Factory Planner, installation, after-sales and technical control towers
- Production Control merges live figures over a zeroed shape and shows a live or empty badge, so a young database is never dressed up as a busy factory
Analysis where the work happens
- Work orders, non-conformances, produced units and labour as pivots
- Survey performance and monthly statistics
- Site quality results, failures, first-pass rate, rework and measurements
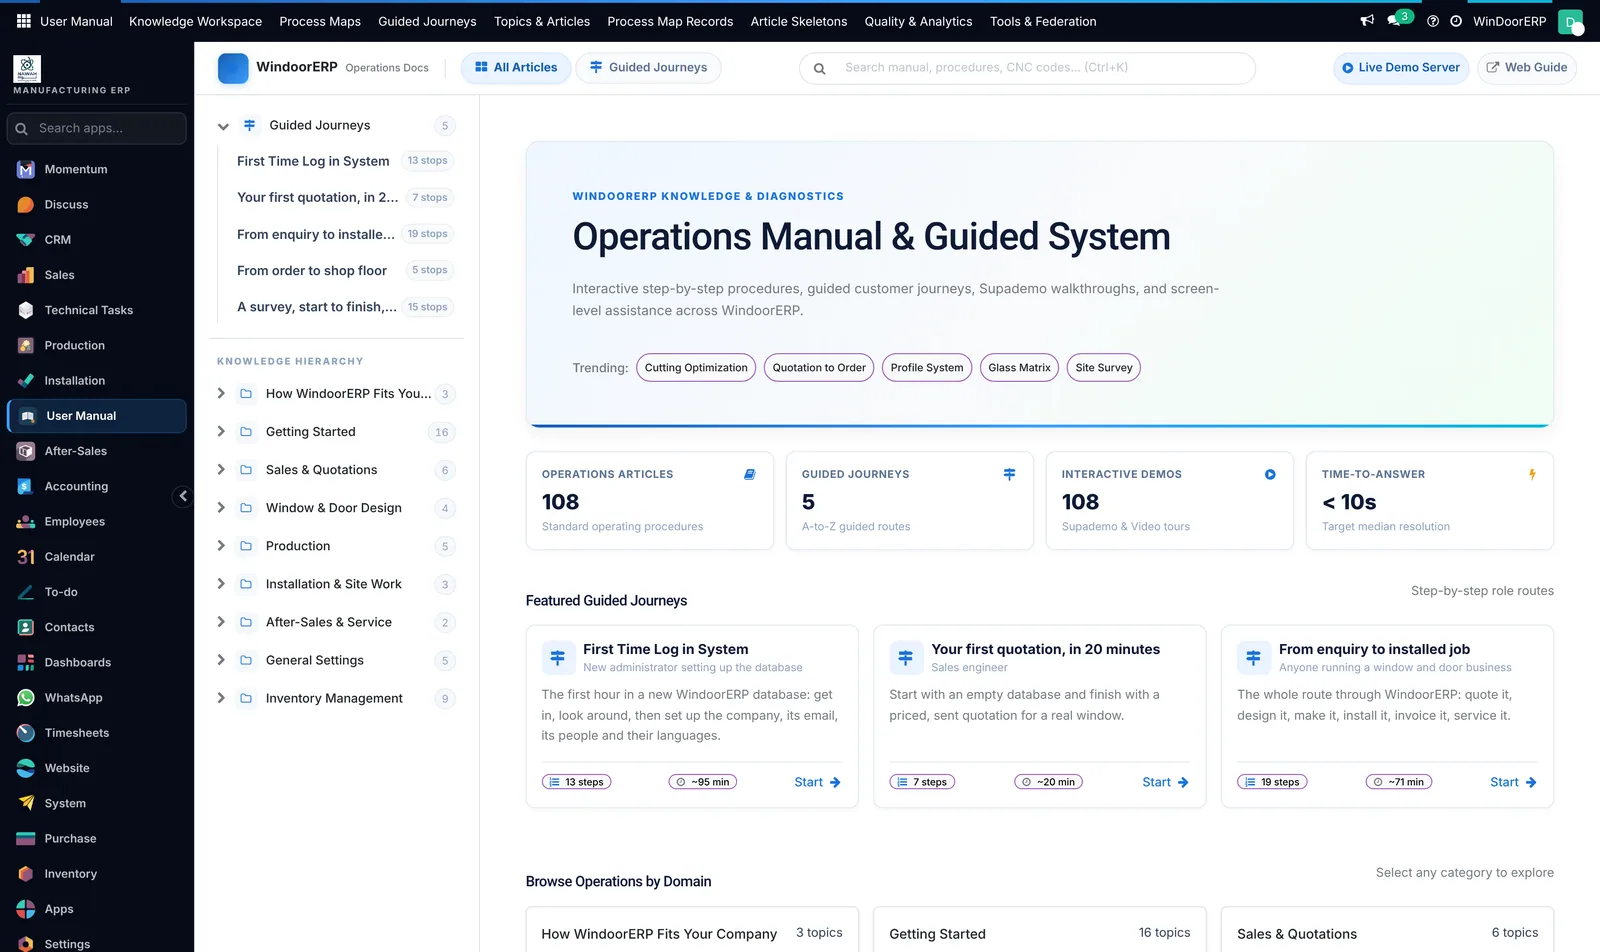
The numbers on the wall
Six OWL dashboards, three live-KPI overviews, per-department pivots, and Odoo's spreadsheet dashboards for invoicing, sales, warehouse metrics and timesheets.
What it produces
Bring one opening.
We will run it end to end.
A drawing, a profile system, or a quotation you have already sent. We load your catalogue into a live tenant and take it from the measured opening to a priced quotation, a costed material list, a nested cut list and a production record — with your hands on the mouse.
45–60 minutes · no slides · on a live database · English or Arabic · we reply within one business day